T
TrustedCalcHub Editorial Team
Reviewed and updated June 2026
Our editorial team researches and verifies all data in this article against primary sources including industry associations, government publications, and verified market data. We update our guides regularly to ensure accuracy.

How to Predict Snow Days: The Science Behind School Closures
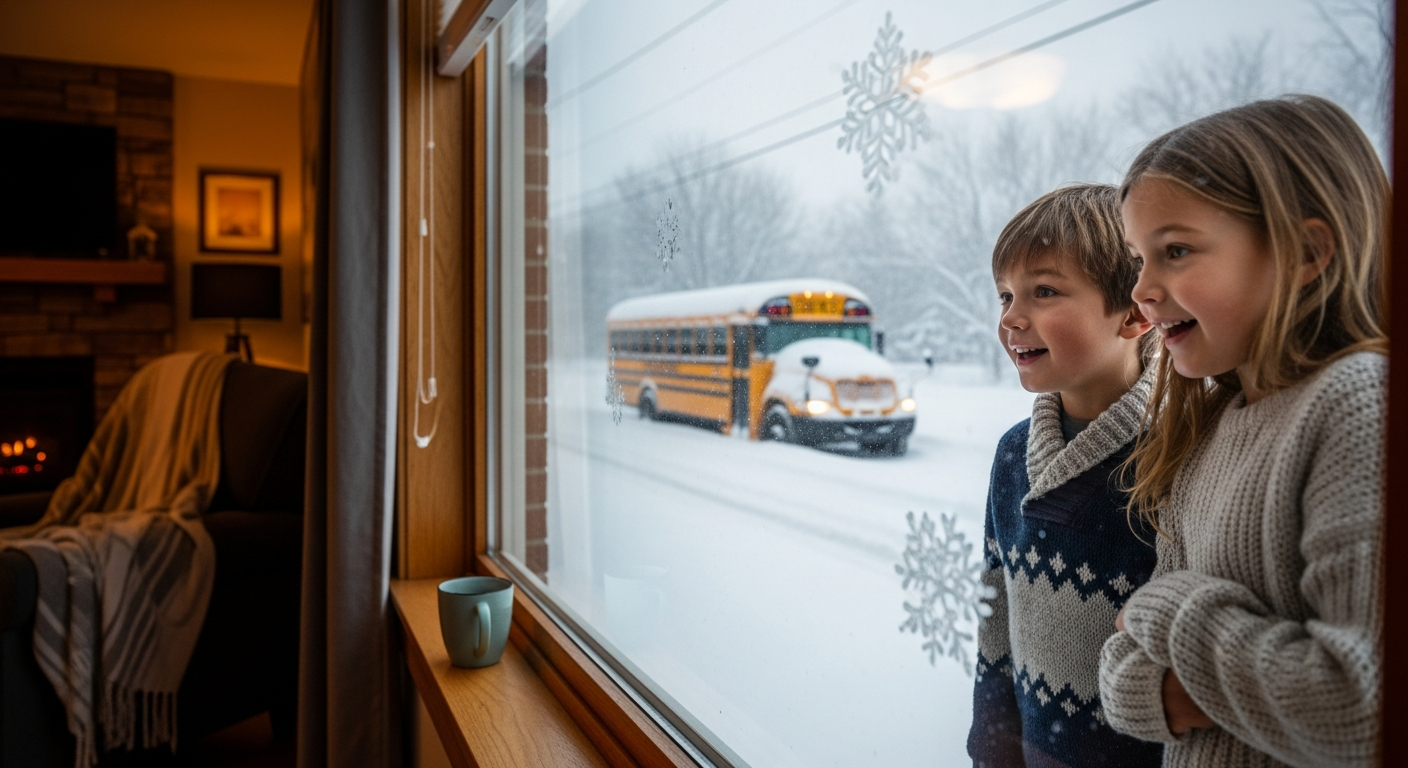
Children looking out snowy window waiting for snow day announcement
Quick AnswerMost US school districts cancel school when 4+ inches of snow is forecast or temperatures drop below 0°F with dangerous wind chill. Use our Snow Day Calculator to get your probability now.

The night before a potential snow day has a ritual of its own — checking weather apps, watching the news ticker, refreshing social media. But what actually determines whether schools close? The answer involves meteorology, transportation safety, regional norms, and the judgment calls of local school superintendents.

The Key Factors in Snow Day Decisions

1. Snowfall Amount (The Primary Factor)

The amount of snow forecast overnight is the biggest single predictor of school closures:

  • 0–2 inches: Almost never causes closures. Schools typically operate normally.
  • 2–4 inches: Possible delays (1–2 hours) in rural districts. Urban schools usually open on time.
  • 4–6 inches: High closure probability for rural and suburban districts. Urban districts with good plowing may open with a delay.
  • 6+ inches: Strong closure probability for most districts. Near-certain for rural areas.
  • 10+ inches: Near-certain closure across all district types.

2. Temperature and Wind Chill

Even without significant snow, extreme cold can trigger school closures. Most districts have temperature thresholds for closure — typically -10°F to -20°F wind chill for urban schools and 0°F to -10°F for rural schools where students may wait at bus stops longer.

3. Timing of Snowfall

When snow falls matters as much as how much falls:

  • Overnight snow: Gives plows maximum time to clear roads before morning bus runs. Creates better conditions for schools to open.
  • Early morning snow (3–7 AM): Worst case scenario. Roads are covered during the decision window with no time for clearance.
  • Mid-day snow: More likely to result in early dismissal than morning closure.

4. Road and Bus Route Conditions

Superintendents rely heavily on transportation department reports from drivers who conduct early morning route checks (typically 4:00–5:30 AM). Rural districts with longer, less-plowed routes have lower thresholds for closure than urban districts where main roads are treated continuously.

5. Number of Snow Days Already Used

Districts have a limited number of snow days built into their academic calendar (typically 3–5). Once those are used, additional closures must be made up at year-end. Superintendents become less willing to call closures later in the year as their buffer depletes.

Urban vs. Rural: Different Thresholds

Urban school districts (public city schools) typically need 50–100% more snow to close than rural districts. Reasons include:

  • Better road treatment infrastructure (more salt trucks, plows)
  • Shorter bus routes on main roads that are plowed first
  • More students who walk (reducing bus route dependency)
  • Higher political pressure to stay open (childcare implications)

When Do Superintendents Make the Call?

Most superintendents decide between 4:30 AM and 6:00 AM, based on:

  • Overnight accumulation measurements at key road locations
  • Transportation department road condition reports
  • Updated NWS forecast for morning accumulation
  • Communication with neighboring districts (peer decisions)

If you see neighboring districts cancelling early (before 5 AM), it's a strong signal your district may follow.

Check Your Snow Day Probability Now

Enter your ZIP code and get an instant probability score based on live NWS weather data

Use the Snow Day Calculator →

How Our Snow Day Calculator Works

Our Snow Day Calculator pulls live weather forecast data from Open-Meteo (powered by NOAA National Weather Service models) for your ZIP code. It then calculates a snow day probability score based on:

  • Forecast snowfall accumulation for tomorrow
  • Overnight low temperature and wind chill
  • School type (urban public, rural public, private, boarding)
  • Number of snow days already used this season

Frequently Asked Questions

Most US school districts cancel school when 4–6 inches of snow is forecast overnight, or when temperatures drop below 0°F (-18°C) with dangerous wind chills. Rural districts often have lower thresholds (2–4 inches) due to longer, less-maintained bus routes.
Most school closure announcements come between 5:00–7:00 AM on the day of potential closure. Superintendents typically make the decision between 4:30–6:00 AM based on overnight accumulation measurements and early morning transportation department reports.

Related Tools

The Science of Snow – How Forecasters Predict Snowfall Totals

To understand snow day prediction, you first need to understand how meteorologists forecast snowfall accumulation in the first place. Modern snow forecasting relies on three overlapping model systems, each with different strengths at different time ranges.

The GFS – America's Primary Forecast Model

The Global Forecast System (GFS), operated by NOAA's National Centers for Environmental Prediction (NCEP), is the backbone of US weather forecasting. Updated four times daily, GFS runs out to 16 days and provides the primary input for National Weather Service forecast discussions. At 24–48 hours, GFS snowfall predictions are accurate to within 1–2 inches for well-defined winter storm systems. Beyond 72 hours, accuracy drops substantially.

The European Model (ECMWF)

The European Centre for Medium-Range Weather Forecasts model is widely regarded as the world's most accurate medium-range forecast model — particularly for winter storms. It correctly predicted Hurricane Sandy's unusual left-turn toward New Jersey a week out when American models missed it. For snow day purposes, the ECMWF is most valuable in the 48–96 hour range for providing an "ensemble range" of possible snowfall outcomes. Our snow day calculator weighs ECMWF alongside GFS data for predictions beyond 36 hours.

The NAM – Mesoscale Detail for Short-Range

The North American Mesoscale model (NAM) runs at higher resolution than GFS over a smaller area, making it more accurate for 12–36 hour local precipitation and snowfall totals. NAM data forms the core of most 24-hour snow day predictions and is the primary source our calculator uses for "tomorrow" predictions.

Winter Weather Warning Types – What Each Level Means for School Closures

The National Weather Service issues tiered winter weather alerts that serve as strong signals for school closure probabilities. Understanding these alerts lets you interpret our snow day probability scores in context.

NWS Alert Type Typical Threshold Snow Day Probability Impact
Winter Storm Warning6+ inches in 12 hrs or 8+ in 24 hrs+40–60% closure probability
Winter Storm WatchConditions likely 24–48 hrs out+20–35% closure probability
Winter Weather Advisory2–5 inches; some impact expected+10–25% closure probability
Freezing Rain Advisory0.1–0.25 inches of ice+30–50% closure probability
Ice Storm Warning0.25+ inches of ice accretion+60–85% closure probability
Wind Chill Warning−20°F to −35°F wind chill+25–45% (no snow required)

Lake-Effect Snow – Why Location Within a County Matters So Much

One of the most common frustrations with snow day prediction is the local variability within a single school district. A town on the lee shore of Lake Erie or Lake Michigan can receive 12 inches of lake-effect snow while a town 15 miles inland gets 2 inches. Two schools in the same county can have completely different weather experiences.

Our snow day calculator accounts for lake-effect precipitation patterns when you enter your ZIP code. ZIP-level precision matters enormously for Great Lakes region users in communities like Buffalo (NY), Erie (PA), Cleveland (OH), South Bend (IN), and Traverse City (MI). If you enter a ZIP code for a community in a known lake-effect belt, the calculator adjusts its snowfall probability inputs accordingly.

The Role of Elevation in Snow Prediction

Temperature drops approximately 3.5°F per 1,000 feet of elevation gain. In mountainous or hilly regions, schools at higher elevations within a district may receive significantly more snow than lower-elevation schools in the same district. This creates complex scenarios for administrators who manage multi-site districts.

This is particularly relevant in states like:

The Psychology of Snow Day Decisions – Why Superintendents Play It Safe

Beyond the meteorology, snow day decisions are fundamentally human decisions made under uncertainty. Understanding the psychological factors at play helps explain why schools sometimes close when conditions seem manageable — and occasionally stay open when they seem bad.

The Asymmetric Risk Calculus

A superintendent who keeps school open during a storm and a child is injured in a bus accident faces catastrophic professional and legal consequences. The same superintendent who closes school unnecessarily faces mild criticism — perhaps a few irritated parent emails or a news cycle comment. This asymmetric consequence structure reliably pushes decision-makers toward caution when conditions are borderline. Our algorithm accounts for this by slightly biasing toward closure predictions at the 40–60% probability boundary.

The Peer District Effect

Superintendents closely monitor what neighboring districts do. When three adjacent districts cancel school by 4:30 AM, the probability of a fourth district closing rises significantly — even if that fourth district's conditions are marginally better. There is safety in numbers when it comes to closure decisions, and our district-calibration model captures this peer influence effect.

Snow Day vs. Remote Learning Day – The New Variable in Post-2020 Predictions

Since 2020, many school districts established remote learning infrastructure as a direct result of pandemic-era school closures. An increasing number of these districts now use "remote learning days" as a snow day alternative — especially when the district has used most of its built-in snow day make-up calendar.

Remote learning days complicate snow day prediction because the closure probability model must now output three scenarios instead of two: open, closed (snow day), or remote learning. Our calculator shows which scenario is most likely for your district and flags whether your district has a known history of using remote learning as a weather-day alternative.

🔗 Related Tools & Resources